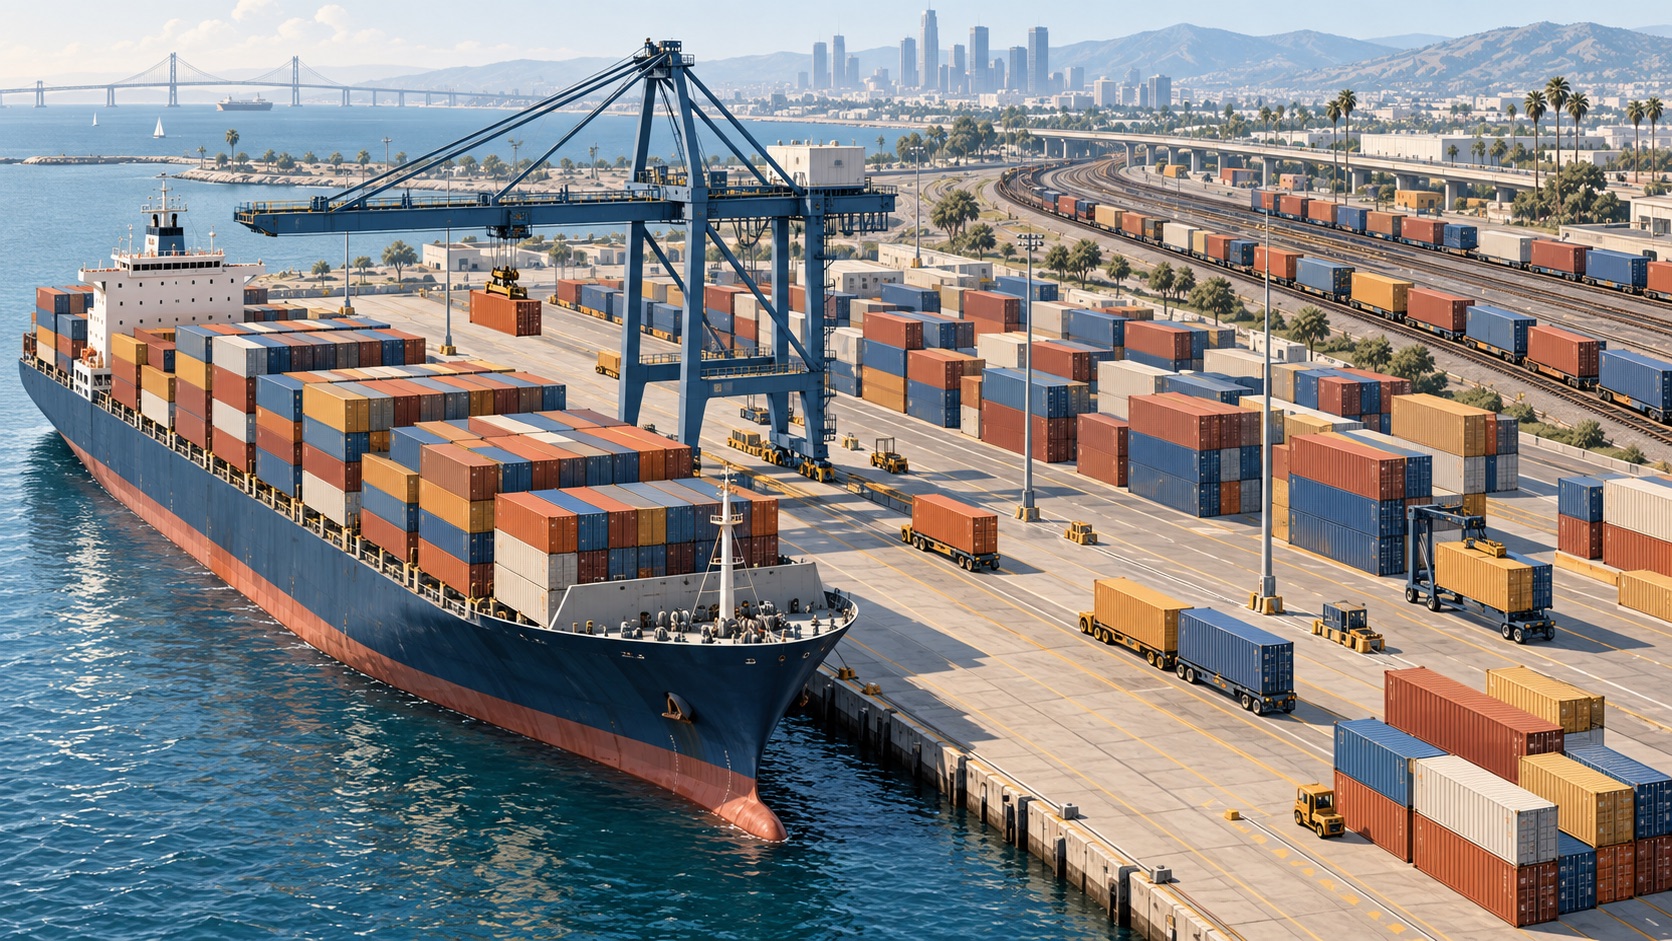
The Port of Los Angeles moved more than 2.9 million twenty-foot equivalent units over June, July and August 2026, its busiest consecutive three months. But August’s 955,907 units were roughly level with August 2025. The distinction matters: a record summer is not the same as a fresh acceleration in loaded imports.
Key facts
- August: 955,907 TEUs, about even with August 2025.
- Loaded imports: 500,302 TEUs; loaded exports: 115,561; empties: 340,044.
- Nivegu calculation from those port counts: 52.3% loaded imports, 12.1% loaded exports and 35.6% empties.
- The January–August total was just over 7 million TEUs, up 1.5% year over year.
Timeline
June–August 2026 — more than 2.9 million TEUs move through the port, a record three-month run. September 9 — the port releases August’s category breakdown. Next — compare subsequent monthly releases with both year-ago and five-year baselines.
Port throughput measures container-equivalent movement, not the value of goods or the cost paid by shoppers. A strong seasonal shipping stretch can coexist with flat year-over-year imports, weaker exports and more empty equipment moving through the terminals.
Watch whether later monthly releases show sustained loaded-import growth, how many empty containers move, and whether inland transport times offset ocean-freight differences for particular routes.
Why the record needs a second look
June through August was the port’s busiest consecutive three-month stretch, yet August by itself was broadly flat against last year. The port also says the month was 6% ahead of its five-year August average. Neither comparison is wrong: one asks whether traffic beat a longer seasonal norm, the other whether it accelerated from a strong year-ago month.
One in three counted units was an empty box
The port’s three August categories add exactly to 955,907 TEUs. Dividing each category by that total, Nivegu calculates that loaded imports accounted for 52.3%, loaded exports 12.1% and empties 35.6%, rounded to one decimal place. Empty containers matter to terminal capacity and equipment flows, but they should not be described as newly imported consumer goods. Exports, meanwhile, were 9% below August 2025 even as empties rose 4%.
What this means beyond the harbor
Port director Gene Seroka said trans-Pacific ocean rates currently favor East Coast routings, while Los Angeles can still compete for some inland shipments through the speed of its rail connection. That is a route-by-route calculation, not proof that all shippers save money. FreightWaves independently reported the port figures and noted the split among imports, exports and empties. The release does not establish what retailers will charge consumers or how much inventory any single chain holds.
What are you still wondering?
Answers will use this briefing and its cited sources.Sources and further reading
01Port of Los Angeles — August 2026 cargo release↗02FreightWaves — independent report on the port’s summer volume↗Questions, answered.
What is the short version?
The Port of Los Angeles moved more than 2.9 million twenty-foot equivalent units over June, July and August 2026, its busiest consecutive three months. But August’s 955,907 units were roughly level with August 2025. The distinction matters: a record summer is not the same as a fresh acceleration in loaded imports.
Why does this matter now?
Port throughput measures container-equivalent movement, not the value of goods or the cost paid by shoppers. A strong seasonal shipping stretch can coexist with flat year-over-year imports, weaker exports and more empty equipment moving through the terminals.
What should readers watch next?
Watch whether later monthly releases show sustained loaded-import growth, how many empty containers move, and whether inland transport times offset ocean-freight differences for particular routes.